Examples
Templates
You are free to combine tracks however you like, but to help you get started we provide premade templates which correspond to frequent use cases. These templates can be initialized by clicking on “Open template” in the gui or using figeno init in the command line
bigwig
A simple template with a single bigwig track, as well a chr_axis and a genes track. You can of course add additional tracks after initializing this template.

{
        "general": {
                "layout": "horizontal",
                "reference": "hg19"
        },
        "output": {
                "file": "figure_bigwig.png",
                "dpi": 400,
                "width": 180
        },
        "regions": [
                {
                        "chr": "12",
                        "start": 11800000,
                        "end": 12100000,
                        "color": "#f4a460"
                }
        ],
        "highlights": [],
        "tracks": [
                {
                        "type": "bigwig",
                        "file": "/path/to/xxx.bigWig",
                        "height": 10,
                        "margin_above": 1.5,
                        "bounding_box": false,
                        "fontscale": 1,
                        "label": "",
                        "label_rotate": false,
                        "color": "#2980b9",
                        "n_bins": 500,
                        "scale": "auto",
                        "scale_pos": "corner"
                },
                {
                        "type": "genes",
                        "height": 10,
                        "margin_above": 1.5,
                        "bounding_box": false,
                        "fontscale": 1,
                        "label": "",
                        "label_rotate": false,
                        "style": "default",
                        "collapsed": true,
                        "only_protein_coding": true,
                        "exon_color": "#2980b9",
                        "genes": "auto"
                },
                {
                        "type": "chr_axis",
                        "height": 10,
                        "margin_above": 1.5,
                        "bounding_box": false,
                        "fontscale": 1,
                        "label": "",
                        "label_rotate": false,
                        "style": "default",
                        "unit": "kb",
                        "ticklabels_pos": "below",
                        "ticks_interval": "auto"
                }
        ]
}
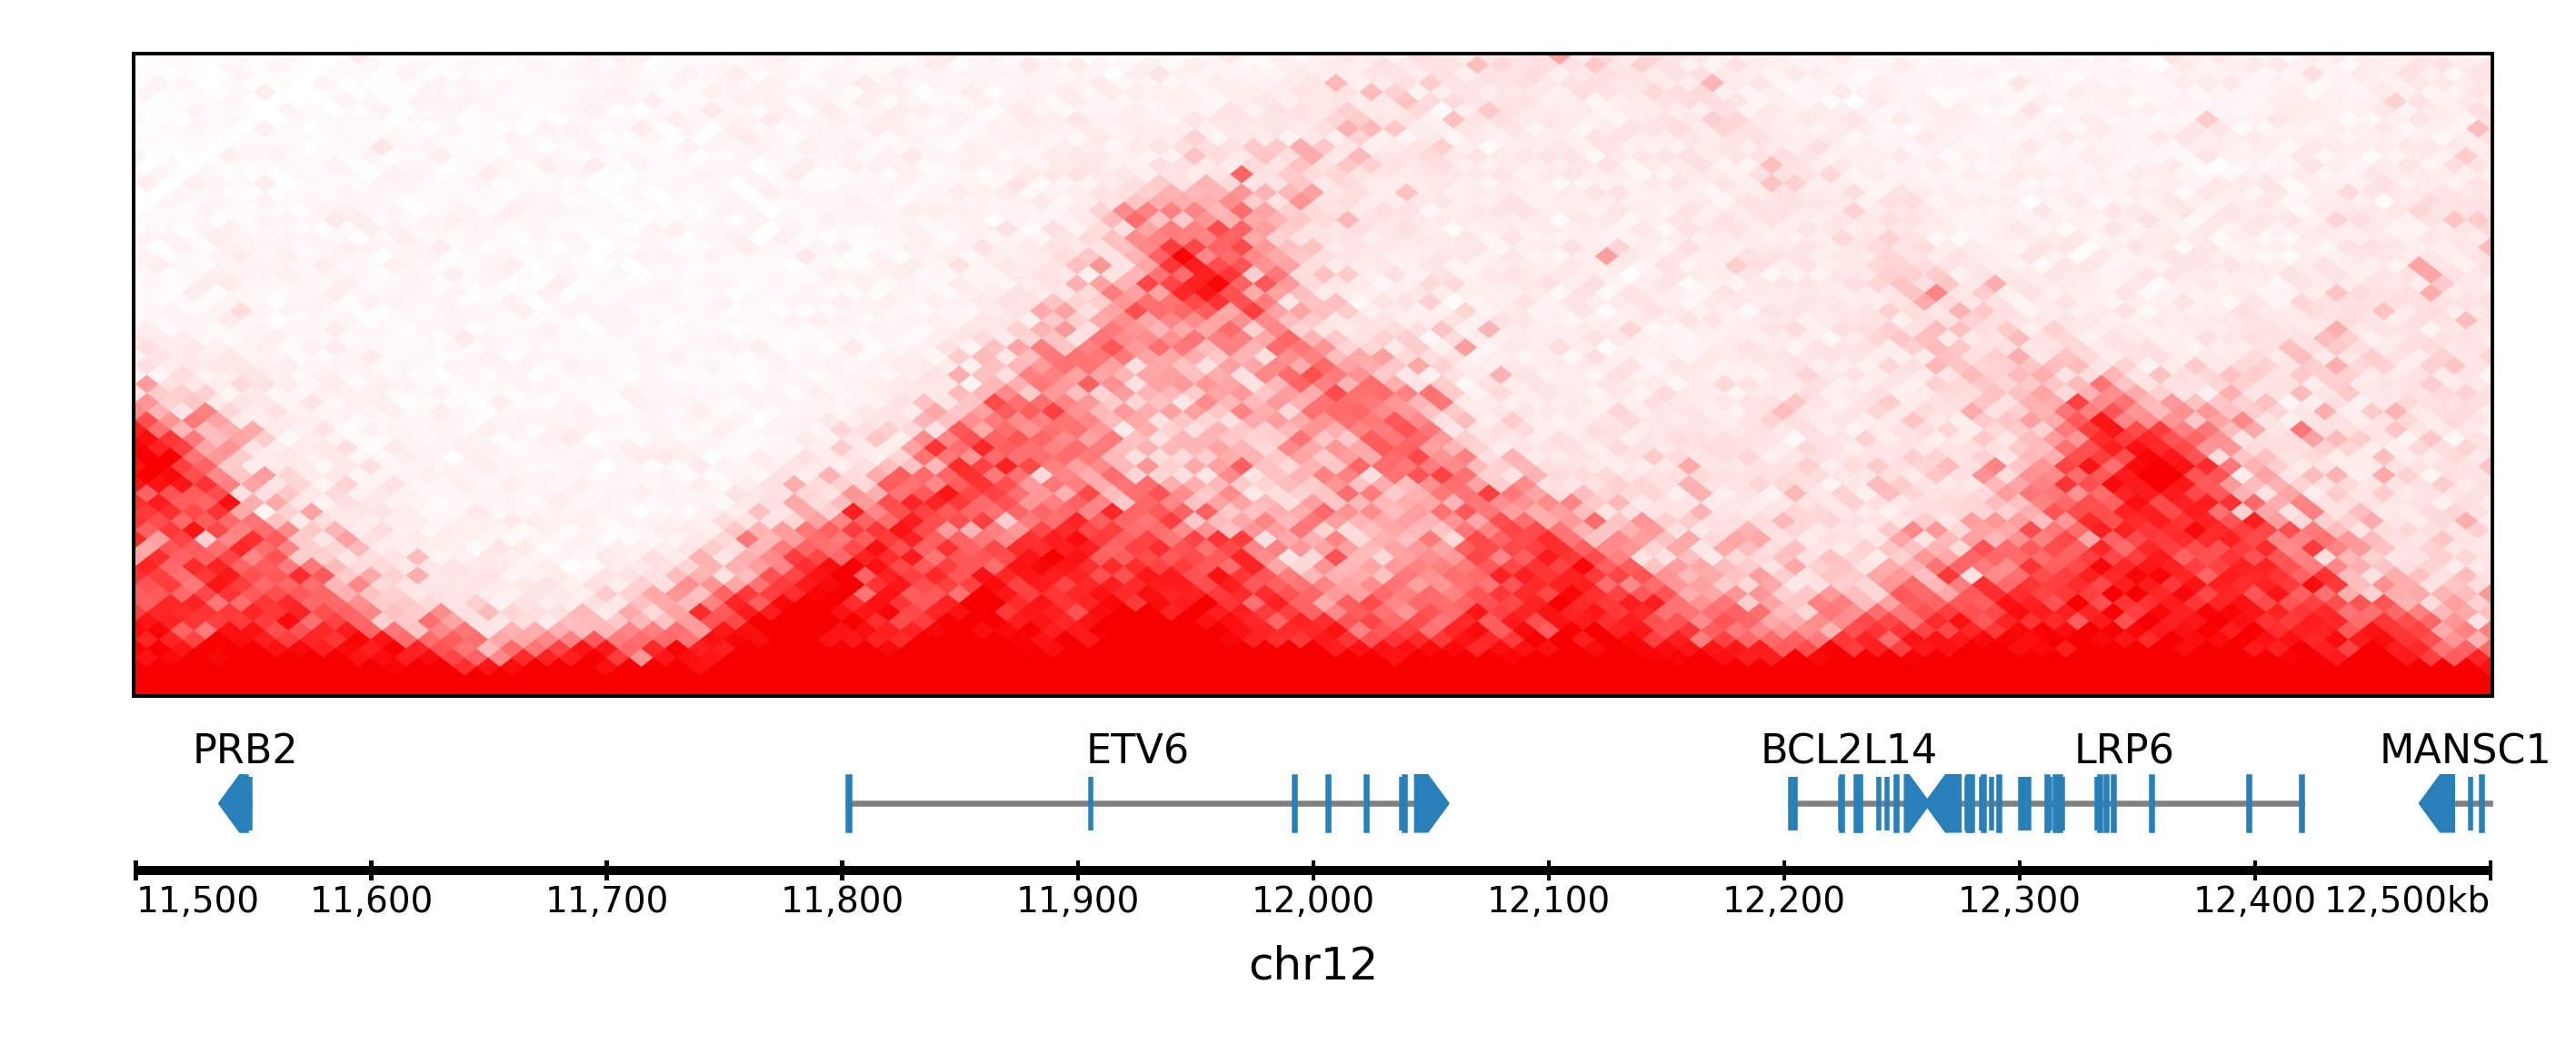
hic
A simple template with a single hic track (showing chromatin interactions from HiC data in .cool format), as well a chr_axis and a genes track. You can of course add additional tracks after inializing this template.
{
        "general": {
                "layout": "horizontal",
                "reference": "hg19"
        },
        "output": {
                "file": "figure_hic.png",
                "dpi": 400,
                "width": 180
        },
        "regions": [
                {
                        "chr": "12",
                        "start": 11500000,
                        "end": 12500000,
                        "color": "#f4a460"
                }
        ],
        "highlights": [],
        "tracks": [
                {
                        "type": "hic",
                        "file": "/path/to/xxx.cool",
                        "height": 50,
                        "margin_above": 1.5,
                        "bounding_box": true,
                        "fontscale": 1,
                        "label": "",
                        "label_rotate": false,
                        "color_map": "red",
                        "pixel_border": false,
                        "upside_down": false,
                        "max_dist": 700,
                        "extend": true,
                        "interactions_across_regions": true,
                        "double_interactions_across_regions": true
                },
                {
                        "type": "genes",
                        "height": 10,
                        "margin_above": 1.5,
                        "bounding_box": false,
                        "fontscale": 1,
                        "label": "",
                        "label_rotate": false,
                        "style": "default",
                        "collapsed": true,
                        "only_protein_coding": true,
                        "exon_color": "#2980b9",
                        "genes": "auto"
                },
                {
                        "type": "chr_axis",
                        "height": 10,
                        "margin_above": 1.5,
                        "bounding_box": false,
                        "fontscale": 1,
                        "label": "",
                        "label_rotate": false,
                        "style": "default",
                        "unit": "kb",
                        "ticklabels_pos": "below",
                        "ticks_interval": "auto"
                }
        ]
}
asm
Allele-specific methylation: show the alignments colored by methylation and split by haplotype, as well as the methylation frequency split by haplotype. This requires the reads to be phased (with an HP tag, e.g. with whatshap) and to contain base modification information (with MM and ML tags).

{
        "general": {
                "layout": "horizontal",
                "reference": "hg19"
        },
        "output": {
                "file": "template_asm.png",
                "dpi": 400,
                "width": 180
        },
        "regions": [
                {
                        "chr": "7",
                        "start": 156795000,
                        "end": 156820000,
                        "color": "#f4a460"
                }
        ],
        "highlights": [],
        "tracks": [
                {
                        "type": "alignments",
                        "file": "/path/to/xxx.bam",
                        "height": 50,
                        "margin_above": 1.5,
                        "bounding_box": false,
                        "fontscale": 1,
                        "label": "",
                        "label_rotate": false,
                        "hgap_bp": 30,
                        "vgap_frac": 0.3,
                        "read_color": "#cccccc",
                        "splitread_color": "#999999",
                        "link_splitreads": false,
                        "min_splitreads_breakpoints": 2,
                        "group_by": "haplotype",
                        "show_unphased": true,
                        "exchange_haplotypes": false,
                        "show_haplotype_colors": true,
                        "haplotype_colors": [
                                "#27ae60",
                                "#e67e22",
                                "#808080"
                        ],
                        "haplotype_labels": [
                                "HP1",
                                "HP2",
                                "Unphased"
                        ],
                        "color_by": "basemod",
                        "color_unmodified": "#0f57e5",
                        "basemods": [
                                [
                                        "C",
                                        "m",
                                        "#f40202"
                                ]
                        ],
                        "fix_hardclip_basemod": false
                },
                {
                        "type": "basemod_freq",
                        "height": 20,
                        "margin_above": 1.5,
                        "bounding_box": true,
                        "fontscale": 1,
                        "label": "Methylation freq",
                        "label_rotate": true,
                        "bams": [
                                {
                                        "file": "/path/to/xxx.bam",
                                        "base": "C",
                                        "mod": "m",
                                        "min_coverage": 6,
                                        "linewidth": 3,
                                        "opacity": 1,
                                        "fix_hardclip": false,
                                        "split_by_haplotype": true,
                                        "colors": [
                                                "#27ae60",
                                                "#e67e22"
                                        ]
                                }
                        ]
                },
                {
                        "type": "genes",
                        "height": 10,
                        "margin_above": 1.5,
                        "bounding_box": false,
                        "fontscale": 1,
                        "label": "",
                        "label_rotate": false,
                        "style": "default",
                        "collapsed": true,
                        "only_protein_coding": true,
                        "exon_color": "#2980b9",
                        "genes": "auto"
                },
                {
                        "type": "chr_axis",
                        "height": 10,
                        "margin_above": 1.5,
                        "bounding_box": false,
                        "fontscale": 1,
                        "label": "",
                        "label_rotate": false,
                        "style": "default",
                        "unit": "kb",
                        "ticklabels_pos": "below",
                        "ticks_interval": "auto"
                }
        ]
}
wgs_chr

{
        "general": {
                "layout": "horizontal",
                "reference": "hg19"
        },
        "output": {
                "dpi": 400,
                "file": "template_wgs_chr.png",
                "width": 180
        },
        "regions": [
                {
                        "chr": "7",
                        "start": null,
                        "end": null,
                        "color": "#f4a460"
                }
        ],
        "highlights": [],
        "tracks": [
                {
                        "type": "sv",
                        "file": "/path/to/xxx_SV.vcf",
                        "height": 15,
                        "margin_above": 1.5,
                        "bounding_box": true,
                        "fontscale": 1,
                        "label": "",
                        "label_rotate": false,
                        "lw": "0.5",
                        "color_del": "#4a69bd",
                        "color_dup": "#e55039",
                        "color_t2t": "#8e44ad",
                        "color_h2h": "#8e44ad",
                        "color_trans": "#27ae60"
                },
                {
                        "type": "copynumber",
                        "height": 30,
                        "margin_above": 0,
                        "bounding_box": true,
                        "fontscale": 1,
                        "label": "",
                        "label_rotate": false,
                        "freec_ratios": "xxx_ratio.txt",
                        "freec_CNAs": "xxx_CNVs",
                        "purple_cn": "",
                        "genes": "",
                        "min_cn": "",
                        "max_cn": "",
                        "grid": true,
                        "grid_major": true,
                        "grid_minor": true,
                        "grid_cn": true,
                        "color_normal": "#000000",
                        "color_loss": "#4a69bd",
                        "color_gain": "#e55039",
                        "color_cnloh": "#f6b93b"
                },
                {
                        "type": "chr_axis",
                        "height": 10,
                        "margin_above": 0,
                        "bounding_box": false,
                        "fontscale": 1,
                        "label": "",
                        "label_rotate": false,
                        "style": "default",
                        "unit": "kb",
                        "ticklabels_pos": "below",
                        "ticks_interval": "auto"
                }
        ]
}
wgs_circos

{
        "general": {
                "layout": "circular",
                "reference": "hg19"
        },
        "output": {
                "file": "",
                "dpi": 400,
                "width": 180
        },
        "regions": [
                {"chr": "1","color": "#98671F"},
                {"chr": "2","color": "#65661B"},
                {"chr": "3""color": "#969833"},
                {"chr": "4","color": "#CE151D"},
                {"chr": "5","color": "#FF1A25"},
                {"chr": "6","color": "#FF0BC8"},
                {"chr": "7","color": "#FFCBCC"},
                {"chr": "8","color": "#FF9931"},
                {"chr": "9","color": "#FFCC3A"},
                {"chr": "10","color": "#FCFF44"},
                {"chr": "11","color": "#C4FF40"},
                {"chr": "12","color": "#00FF3B"},
                {"chr": "13","color": "#2F7F1E"},
                {"chr": "14","color": "#2800C6"},
                {"chr": "15","color": "#6A96FA"},
                {"chr": "16","color": "#98CAFC"},
                {"chr": "17","color": "#00FEFD"},
                {"chr": "18","color": "#C9FFFE"},
                {"chr": "19","color": "#9D00C6"},
                {"chr": "20","color": "#D232FA"},
                {"chr": "21","color": "#956DB5"},
                {"chr": "22","color": "#5D5D5D"},
                {"chr": "X","color": "#989898"},
                {"chr": "Y","color": "#CBCBCB"}
        ],
        "highlights": [],
        "tracks": [
                {
                        "type": "sv",
                        "file": "/path/to/xxx_SV.vcf",
                        "height": 15,
                        "margin_above": 1.5,
                        "bounding_box": true,
                        "fontscale": 1,
                        "label": "",
                        "label_rotate": false,
                        "lw": "0.5",
                        "color_del": "#4a69bd",
                        "color_dup": "#e55039",
                        "color_t2t": "#8e44ad",
                        "color_h2h": "#8e44ad",
                        "color_trans": "#27ae60"
                },
                {
                        "type": "copynumber",
                        "height": 30,
                        "margin_above": 0,
                        "bounding_box": true,
                        "fontscale": 1,
                        "label": "",
                        "label_rotate": false,
                        "freec_ratios": "xxx_ratio.txt",
                        "freec_CNAs": "xxx_CNVs",
                        "purple_cn": "",
                        "genes": "",
                        "min_cn": "",
                        "max_cn": 3.9,
                        "grid": true,
                        "grid_major": false,
                        "grid_minor": false,
                        "grid_cn": true,
                        "color_normal": "#000000",
                        "color_loss": "#4a69bd",
                        "color_gain": "#e55039",
                        "color_cnloh": "#f6b93b"
                },
                {
                        "type": "chr_axis",
                        "height": 10,
                        "margin_above": 0,
                        "bounding_box": false,
                        "fontscale": 1,
                        "label": "",
                        "label_rotate": false,
                        "style": "default",
                        "unit": "kb",
                        "ticklabels_pos": "below",
                        "ticks_interval": "auto"
                }
        ]
}
Other examples
HiC data across breakpoints
If you have HiC data for a sample with a structural rearrangement, you can use several regions around the breakpoint to visualize chromatin interactions across this rearrangement. The data to replicate this figure can be found at https://github.com/CompEpigen/figeno/tree/main/test_data (files starting with LNCaP).

{
    "general": {
            "layout": "horizontal",
            "reference": "hg38"
    },
    "output": {
            "dpi": 400,
            "file": "LNCaP_figure.svg",
            "width": 80
    },
    "regions": [
            {
                    "chr": "7",
                    "start": 13100000,
                    "end": 14150000,
                    "color": "#f4a460"
            },
            {
                    "chr": "14",
                    "start": 37510000,
                    "end": 36600000,
                    "color": "#95CDCD"
            }
    ],
    "highlights": [],
    "tracks": [
            {
                    "type": "hic",
                    "height": 25,
                    "margin_above": 1.5,
                    "bounding_box": true,
                    "fontscale": 1,
                    "label": "HiC   ",
                    "label_rotate": false,
                    "file": "LNCaP_subset_hg38.cool",
                    "color_map": "red",
                    "pixel_border": false,
                    "upside_down": false,
                    "max_dist": "1300",
                    "extend": true,
                    "scale": "auto",
                    "scale_max_percentile": 90,
                    "show_colorbar": false,
                    "interactions_across_regions": true,
                    "double_interactions_across_regions": true
            },
            {
                    "type": "bigwig",
                    "height": 10,
                    "margin_above": 1.5,
                    "bounding_box": false,
                    "fontscale": 1,
                    "label": "DNase-seq",
                    "label_rotate": false,
                    "file": "LNCaP_ENCFF282KWR_subset.bigwig",
                    "color": "#2980b9",
                    "n_bins": 500,
                    "scale": "auto",
                    "scale_pos": "corner"
            },
            {
                    "type": "genes",
                    "height": 11,
                    "margin_above": 1.5,
                    "bounding_box": false,
                    "fontscale": 1,
                    "label": "",
                    "label_rotate": false,
                    "style": "default",
                    "collapsed": true,
                    "only_protein_coding": true,
                    "exon_color": "#2980b9",
                    "genes": "auto"
            },
            {
                    "type": "chr_axis",
                    "height": 10,
                    "margin_above": 1.5,
                    "bounding_box": false,
                    "fontscale": 0.8,
                    "label": "",
                    "label_rotate": false,
                    "style": "arrow",
                    "unit": "Mb",
                    "ticklabels_pos": "below",
                    "ticks_interval": "auto"
            }
    ]
}
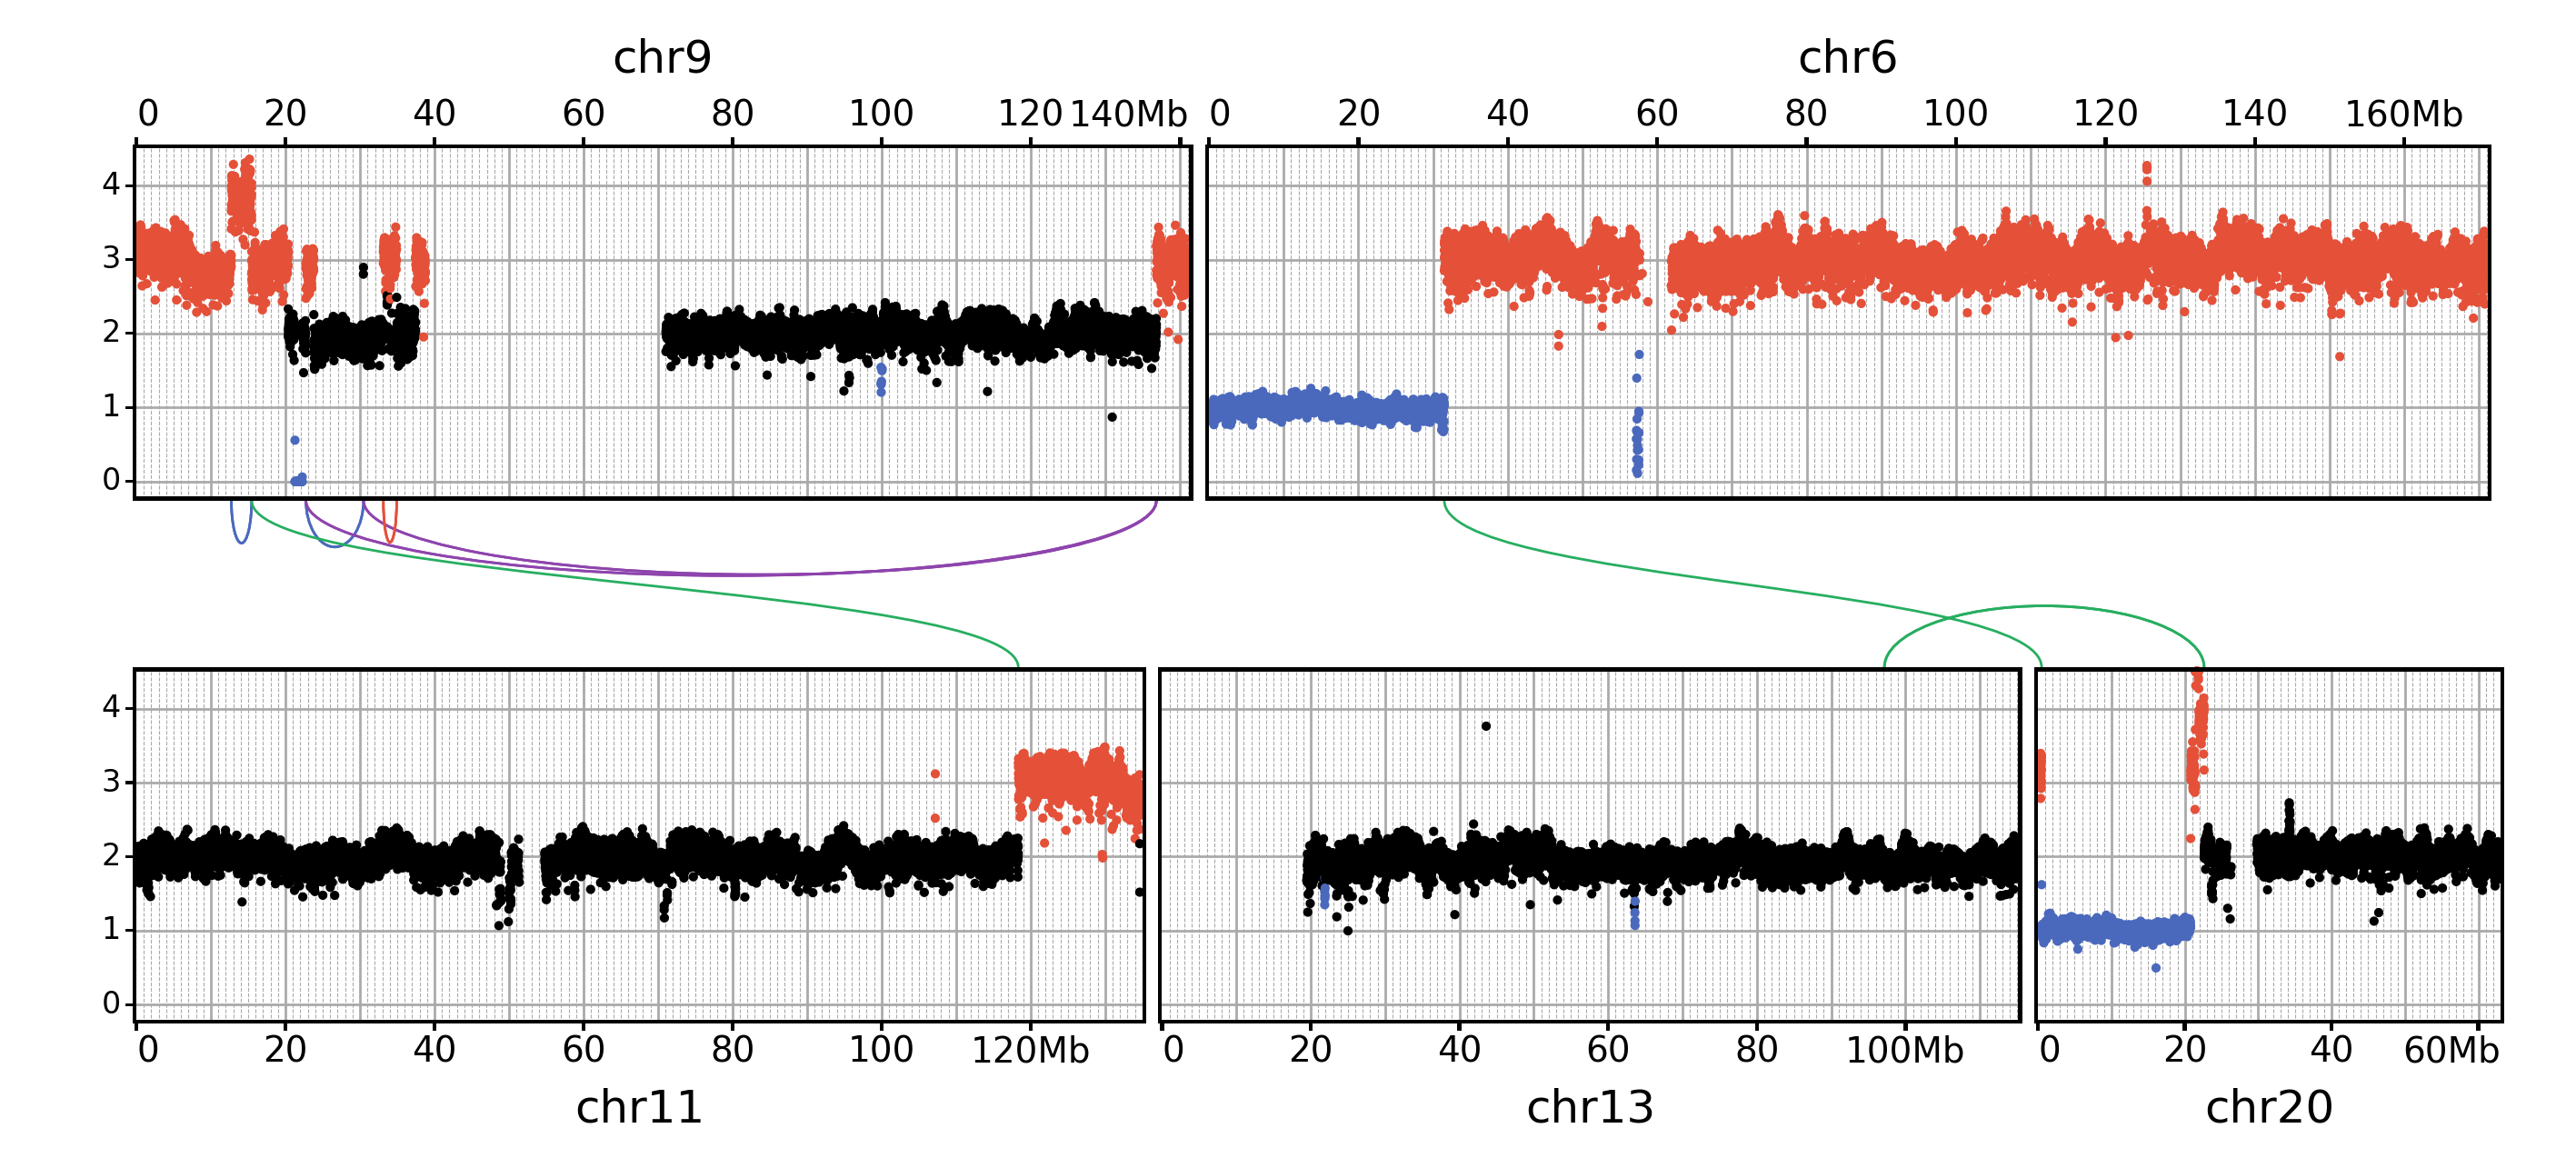
Symmetrical layout for WGS
For WGS data, you can use the “symmetrical” layout to show the copy-number data on two rows, with the SVs in between. The data to replicate this figure can be found at https://github.com/CompEpigen/figeno/tree/main/test_data (files starting with THP1).
{
    "general": {
            "layout": "symmetrical",
            "reference": "hg19"
    },
    "output": {
            "dpi": 400,
            "file": "THP1_symmetrical_figure.png",
            "width": 180
    },
    "regions": [
            {"chr": "9"},
            {"chr": "6"},
            {"chr": "11"},
            {"chr": "13"},
            {"chr": "20"}
    ],
    "highlights": [],
    "tracks": [
            {
                    "type": "sv",
                    "height": 6,
                    "margin_above": 1.5,
                    "bounding_box": false,
                    "fontscale": 1,
                    "label": "",
                    "label_rotate": false,
                    "file": "THP1_SV.vcf",
                    "lw": "0.5",
                    "color_del": "#4a69bd",
                    "color_dup": "#e55039",
                    "color_t2t": "#8e44ad",
                    "color_h2h": "#8e44ad",
                    "color_trans": "#27ae60"
            },
            {
                    "type": "copynumber",
                    "height": 25,
                    "margin_above": 0,
                    "bounding_box": true,
                    "fontscale": 1,
                    "label": "",
                    "label_rotate": false,
                    "freec_ratios": "THP1_ratio.txt",
                    "freec_CNAs": "THP1_CNVs",
                    "purple_cn": "",
                    "genes": "",
                    "ploidy": "2",
                    "min_cn": "",
                    "max_cn": "4.5",
                    "grid": true,
                    "grid_major": true,
                    "grid_minor": true,
                    "grid_cn": true,
                    "marker_size": "0.7",
                    "color_normal": "#000000",
                    "color_loss": "#4a69bd",
                    "color_gain": "#e55039",
                    "color_cnloh": "#f6b93b"
            },
            {
                    "type": "chr_axis",
                    "height": 8,
                    "margin_above": 0,
                    "bounding_box": false,
                    "fontscale": 1,
                    "label": "",
                    "label_rotate": false,
                    "style": "default",
                    "unit": "Mb",
                    "ticklabels_pos": "below",
                    "ticks_interval": "20000000"
            }
    ]
}
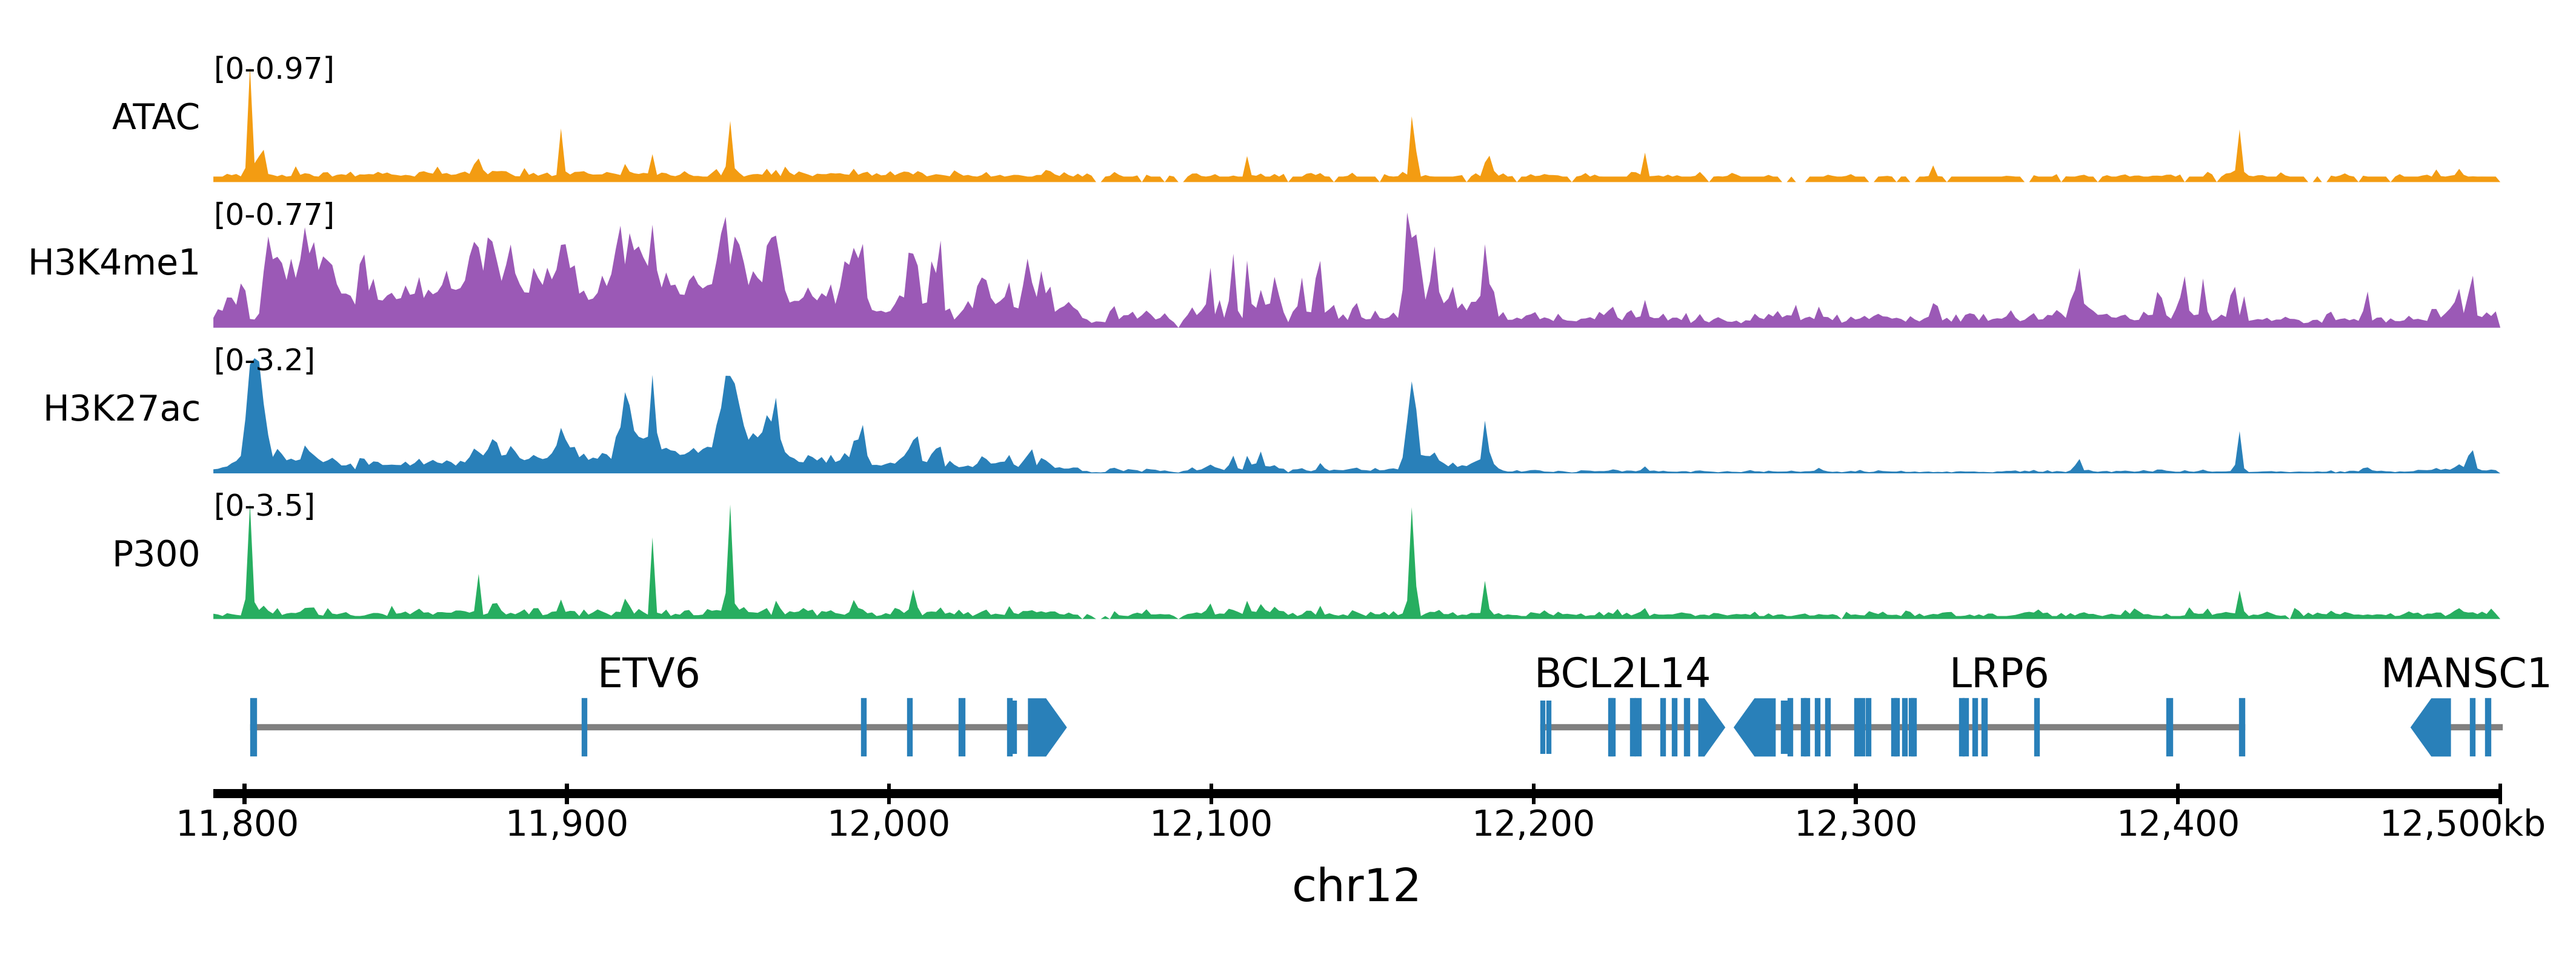
Multiple bigwig tracks
Multiple bigwig tracks can be combined, for example to show different epigenetic marks.
{
            "general": {
                    "layout": "horizontal",
                    "reference": "hg19"
            },
            "output": {
                    "file": "figure_multiple_bigwigs.png",
                    "dpi": 600,
                    "width": 180
            },
            "regions": [
                    {
                            "chr": "12",
                            "start": 11790322,
                            "end": 12500000
                    }
            ],
            "highlights": [],
            "tracks": [
                    {
                            "type": "bigwig",
                            "height": 10,
                            "margin_above": 1.5,
                            "bounding_box": false,
                            "fontscale": 1,
                            "label": "ATAC",
                            "label_rotate": false,
                            "file": "/path/to/ATAC.bigwig",
                            "color": "#f39c12",
                            "n_bins": 500,
                            "scale": "auto",
                            "scale_pos": "corner",
                            "upside_down": false
                    },
                    {
                            "type": "bigwig",
                            "height": 10,
                            "margin_above": 1.5,
                            "bounding_box": false,
                            "fontscale": 1,
                            "label": "H3K4me1",
                            "label_rotate": false,
                            "file": "/path/t8/H3K4me1.bigWig",
                            "color": "#9b59b6",
                            "n_bins": 500,
                            "scale": "auto",
                            "scale_pos": "corner",
                            "upside_down": false
                    },
                    {
                            "type": "bigwig",
                            "height": 10,
                            "margin_above": 1.5,
                            "bounding_box": false,
                            "fontscale": 1,
                            "label": "H3K27ac",
                            "label_rotate": false,
                            "file": "/path/to/H3K27ac.bigWig",
                            "color": "#2980b9",
                            "n_bins": 500,
                            "scale": "auto",
                            "scale_pos": "corner",
                            "upside_down": false
                    },
                    {
                            "type": "bigwig",
                            "height": 10,
                            "margin_above": 1.5,
                            "bounding_box": false,
                            "fontscale": 1,
                            "label": "P300",
                            "label_rotate": false,
                            "file": "/path/to/P300.bigWig",
                            "color": "#27ae60",
                            "n_bins": 500,
                            "scale": "auto",
                            "scale_pos": "corner",
                            "upside_down": false
                    },
                    {
                            "type": "genes",
                            "height": 10,
                            "margin_above": 1.5,
                            "bounding_box": false,
                            "fontscale": 1,
                            "label": "",
                            "label_rotate": false,
                            "style": "default",
                            "collapsed": true,
                            "only_protein_coding": true,
                            "exon_color": "#2980b9",
                            "genes": "auto",
                            "show_gene_names": true
                    },
                    {
                            "type": "chr_axis",
                            "height": 10,
                            "margin_above": 1.5,
                            "bounding_box": false,
                            "fontscale": 1,
                            "label": "",
                            "label_rotate": false,
                            "style": "default",
                            "lw_scale": "1.0",
                            "ticklabels_pos": "below",
                            "unit": "kb",
                            "ticks_interval": "auto",
                            "ticks_angle": 0,
                            "chr_prefix": "chr"
                    }
            ]
    }
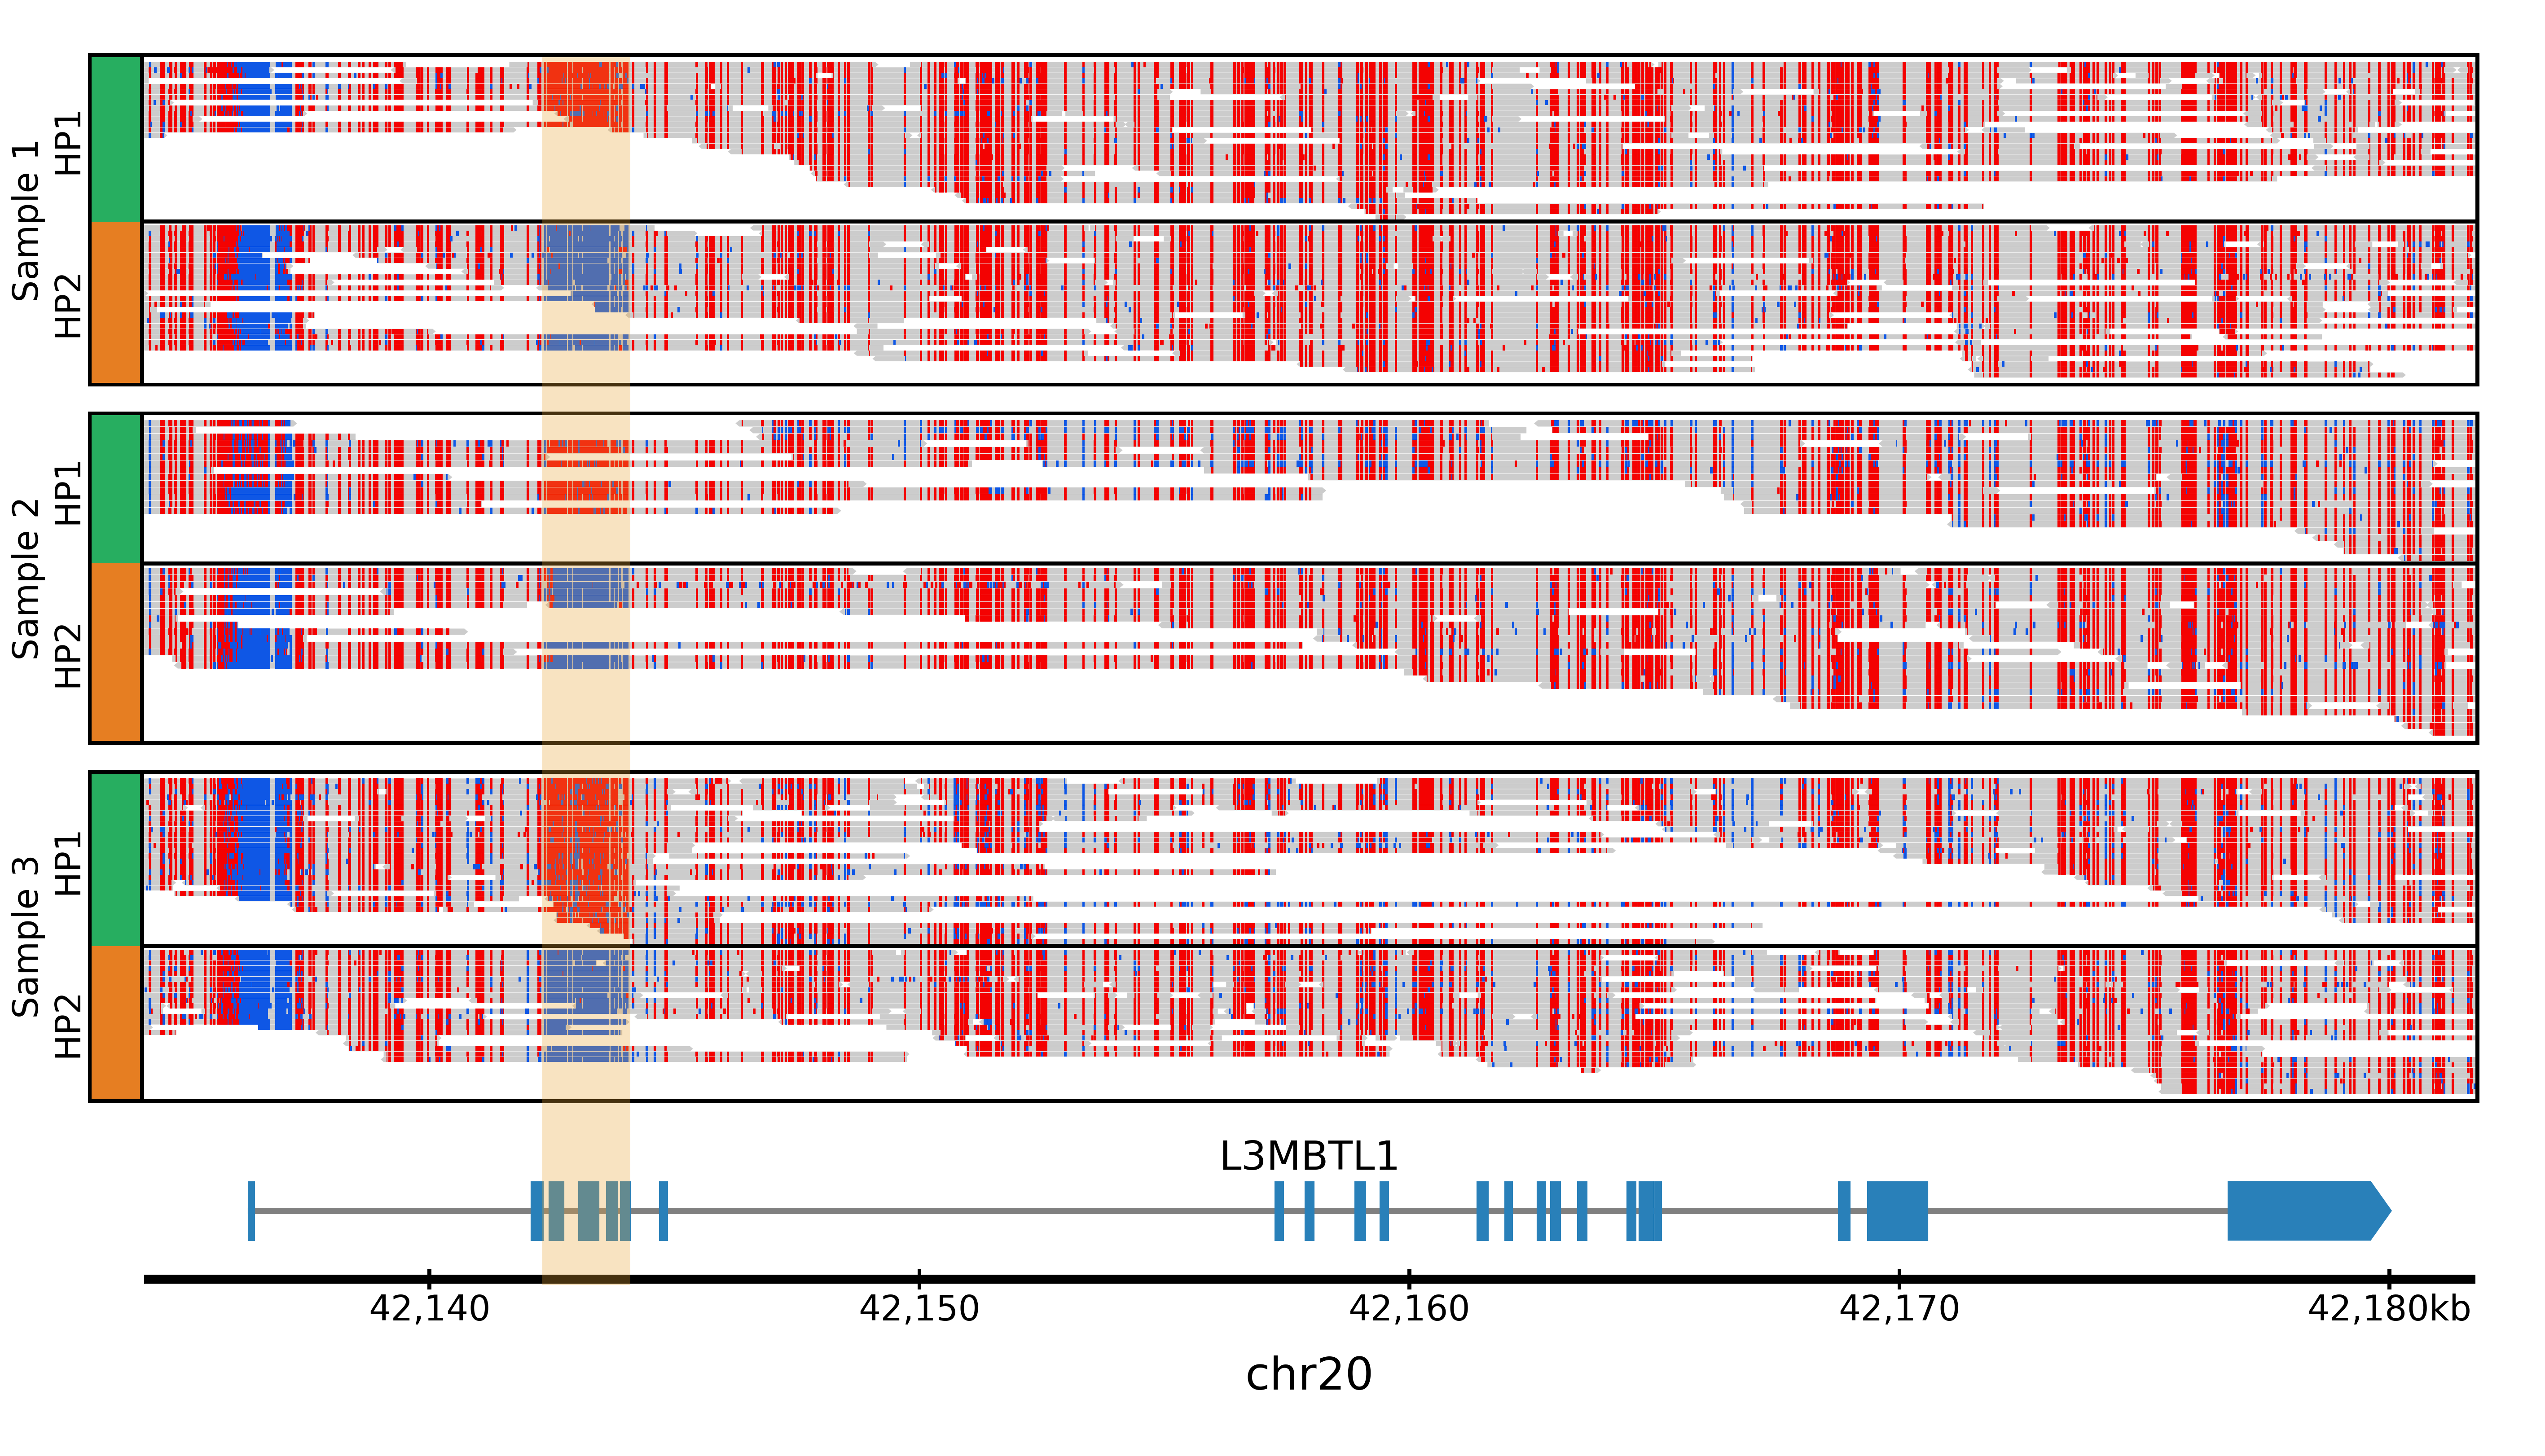
Multiple ONT samples with allele-specific methylation
Here, an imprinted gene is shown, with allele-specific methylation observed in three samples, and the imprinting control region highlighted. To group the reads by haplotype, they have to be phased, using for example whatshap, so that each phased read has an HP tag in the bam file. The haplotype (1 or 2) is arbitrary, so here in order to always show the methylated (maternal) haplotype first, exchange_haplotypes was set to true for the first sample. Compared to the default settings, vgap_frac was reduced to 0.05 for the alignments tracks (to reduce the vertical space between reads), height was reduced to 25 for the alignments track, show_unphased was set to false (to only show phased reads), and margin_above was increased for the alignments track.
{
            "general": {
                    "layout": "horizontal",
                    "reference": "hg19"
            },
            "output": {
                    "file": "figure_multiple_asm.png",
                    "dpi": 800,
                    "width": 180
            },
            "regions": [
                    {
                            "chr": "20",
                            "start": 42134174,
                            "end": 42181756
                    }
            ],
            "highlights": [
                    {
                            "chr": "20",
                            "start": 42142300,
                            "end": 42144100,
                            "color": "#eba434",
                            "opacity": 0.3
                    }
            ],
            "tracks": [
                    {
                            "type": "alignments",
                            "height": 25,
                            "margin_above": 1.5,
                            "bounding_box": true,
                            "fontscale": 1,
                            "file": "/path/to/sample1.haplotagged.bam",
                            "label": "Sample 1",
                            "label_rotate": true,
                            "hgap_bp": 30,
                            "vgap_frac": "0.05",
                            "read_color": "#cccccc",
                            "link_splitreads": false,
                            "group_by": "haplotype",
                            "show_unphased": false,
                            "exchange_haplotypes": true,
                            "show_haplotype_colors": true,
                            "haplotype_colors": [
                                    "#27ae60",
                                    "#e67e22",
                                    "#808080"
                            ],
                            "haplotype_labels": [
                                    "HP1",
                                    "HP2",
                                    "Unphased"
                            ],
                            "color_by": "basemod",
                            "color_unmodified": "#0f57e5",
                            "basemods": [
                                    [
                                            "C",
                                            "m",
                                            "#f40202"
                                    ]
                            ],
                            "fix_hardclip_basemod": false
                    },
                    {
                            "type": "alignments",
                            "height": 25,
                            "margin_above": 2.5,
                            "bounding_box": true,
                            "fontscale": 1,
                            "file": "/path/to/sample2.haplotagged.bam",
                            "label": "Sample 2",
                            "label_rotate": true,
                            "hgap_bp": 30,
                            "vgap_frac": "0.05",
                            "read_color": "#cccccc",
                            "link_splitreads": false,
                            "group_by": "haplotype",
                            "show_unphased": false,
                            "exchange_haplotypes": false,
                            "show_haplotype_colors": true,
                            "haplotype_colors": [
                                    "#27ae60",
                                    "#e67e22",
                                    "#808080"
                            ],
                            "haplotype_labels": [
                                    "HP1",
                                    "HP2",
                                    "Unphased"
                            ],
                            "color_by": "basemod",
                            "color_unmodified": "#0f57e5",
                            "basemods": [
                                    [
                                            "C",
                                            "m",
                                            "#f40202"
                                    ]
                            ],
                            "fix_hardclip_basemod": false
                    },
                    {
                            "type": "alignments",
                            "height": 25,
                            "margin_above": 2.5,
                            "bounding_box": true,
                            "fontscale": 1,
                            "file": "/path/to/sample3.haplotagged.bam",
                            "label": "Sample 3",
                            "label_rotate": true,
                            "hgap_bp": 30,
                            "vgap_frac": "0.05",
                            "read_color": "#cccccc",
                            "link_splitreads": false,
                            "group_by": "haplotype",
                            "show_unphased": false,
                            "exchange_haplotypes": false,
                            "show_haplotype_colors": true,
                            "haplotype_colors": [
                                    "#27ae60",
                                    "#e67e22",
                                    "#808080"
                            ],
                            "haplotype_labels": [
                                    "HP1",
                                    "HP2",
                                    "Unphased"
                            ],
                            "color_by": "basemod",
                            "color_unmodified": "#0f57e5",
                            "basemods": [
                                    [
                                            "C",
                                            "m",
                                            "#f40202"
                                    ]
                            ],
                            "fix_hardclip_basemod": false
                    },
                    {
                            "type": "genes",
                            "height": 10,
                            "margin_above": 1.5,
                            "bounding_box": false,
                            "fontscale": 1,
                            "label": "",
                            "label_rotate": false,
                            "style": "default",
                            "collapsed": true,
                            "only_protein_coding": true,
                            "exon_color": "#2980b9",
                            "genes": "auto",
                            "show_gene_names": true
                    },
                    {
                            "type": "chr_axis",
                            "height": 10,
                            "margin_above": 1.5,
                            "bounding_box": false,
                            "fontscale": 1,
                            "label": "",
                            "label_rotate": false,
                            "style": "default",
                            "lw_scale": "1.0",
                            "ticklabels_pos": "below",
                            "unit": "kb",
                            "ticks_interval": "auto",
                            "ticks_angle": 0,
                            "chr_prefix": "chr"
                    }
            ]
    }
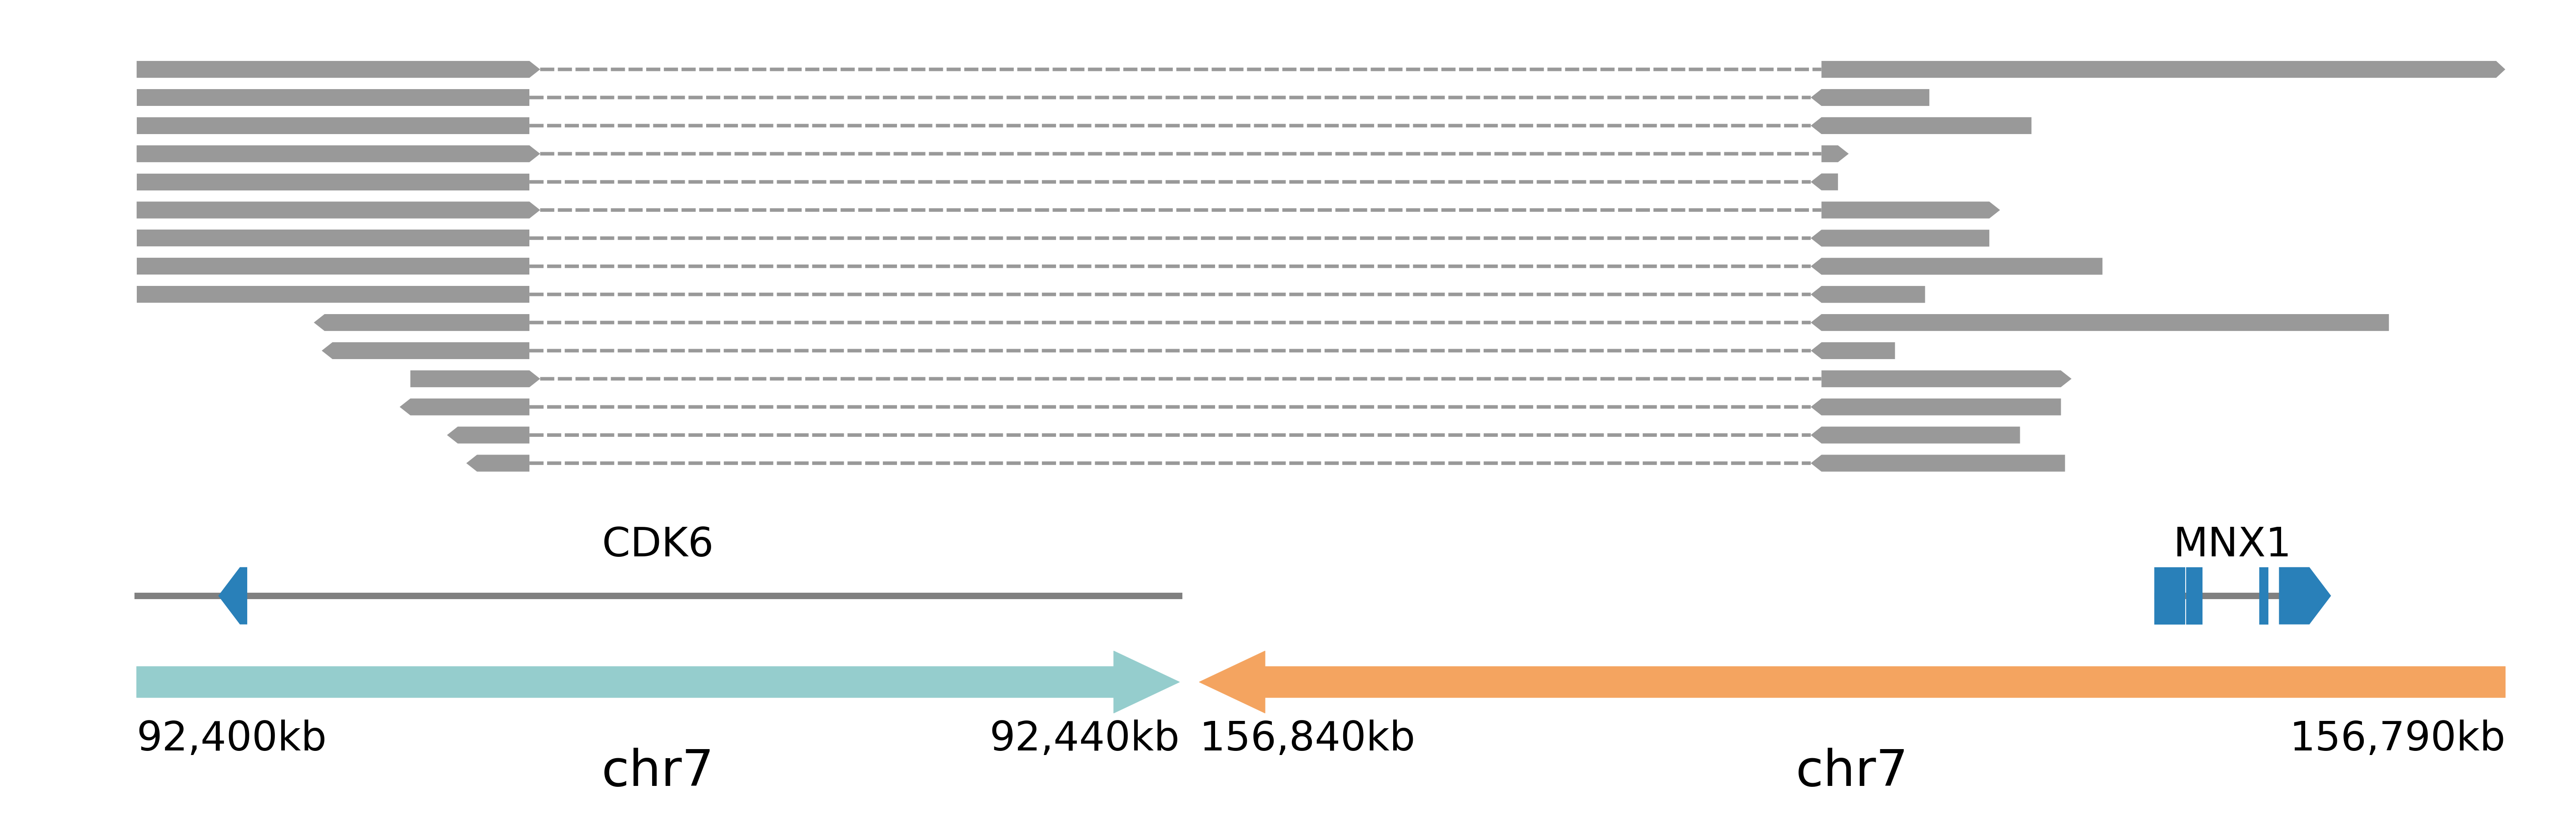
Linking split reads
If a read, and especially a long read, spans a breakpoint, it will be aligned to two different positions in the genome (split read). Figeno can display links between different alignments of a split read (when both alignments are in the regions being displayed), which can be helpful to visualize the breakpoints. Here, we show nanopore reads for a sample with a rearrangement near MNX1, resulting in MNX1 activation by hijacking an enhancer in the CDK6 region.
{
        "general": {
                "layout": "horizontal",
                "reference": "hg19"
        },
        "output": {
                "dpi": 800,
                "file": "figure_linkSR.png",
                "width": 180
        },
        "regions": [
                {
                        "chr": "7",
                        "start": 92400000,
                        "end": 92440000,
                        "color": "#95cdcd"
                },
                {
                        "chr": "7",
                        "start": 156840000,
                        "end": 156790000,
                        "color": "#f4a460"
                }
        ],
        "highlights": [],
        "tracks": [
                {
                        "type": "alignments",
                        "height": 35,
                        "margin_above": 1.5,
                        "bounding_box": false,
                        "fontscale": 1,
                        "file": "/path/to/sample.haplotagged.bam",
                        "label": "",
                        "label_rotate": true,
                        "hgap_bp": 30,
                        "vgap_frac": "0.4",
                        "read_color": "#cccccc",
                        "link_splitreads": true,
                        "splitread_color": "#999999",
                        "link_color": "#999999",
                        "link_lw": "0.7",
                        "only_show_splitreads": true,
                        "min_splitreads_breakpoints": 2,
                        "group_by": "none",
                        "color_by": "none"
                },
                {
                        "type": "genes",
                        "height": 10,
                        "margin_above": 1.5,
                        "bounding_box": false,
                        "fontscale": 1,
                        "label": "",
                        "label_rotate": false,
                        "style": "default",
                        "collapsed": true,
                        "only_protein_coding": true,
                        "exon_color": "#2980b9",
                        "genes": "auto",
                        "show_gene_names": true
                },
                {
                        "type": "chr_axis",
                        "height": 10,
                        "margin_above": 1.5,
                        "bounding_box": false,
                        "fontscale": 1,
                        "label": "",
                        "label_rotate": false,
                        "style": "arrow",
                        "lw_scale": "1.0",
                        "ticklabels_pos": "below",
                        "unit": "kb",
                        "ticks_interval": "auto",
                        "ticks_angle": 0,
                        "chr_prefix": "chr"
                }
        ]
}
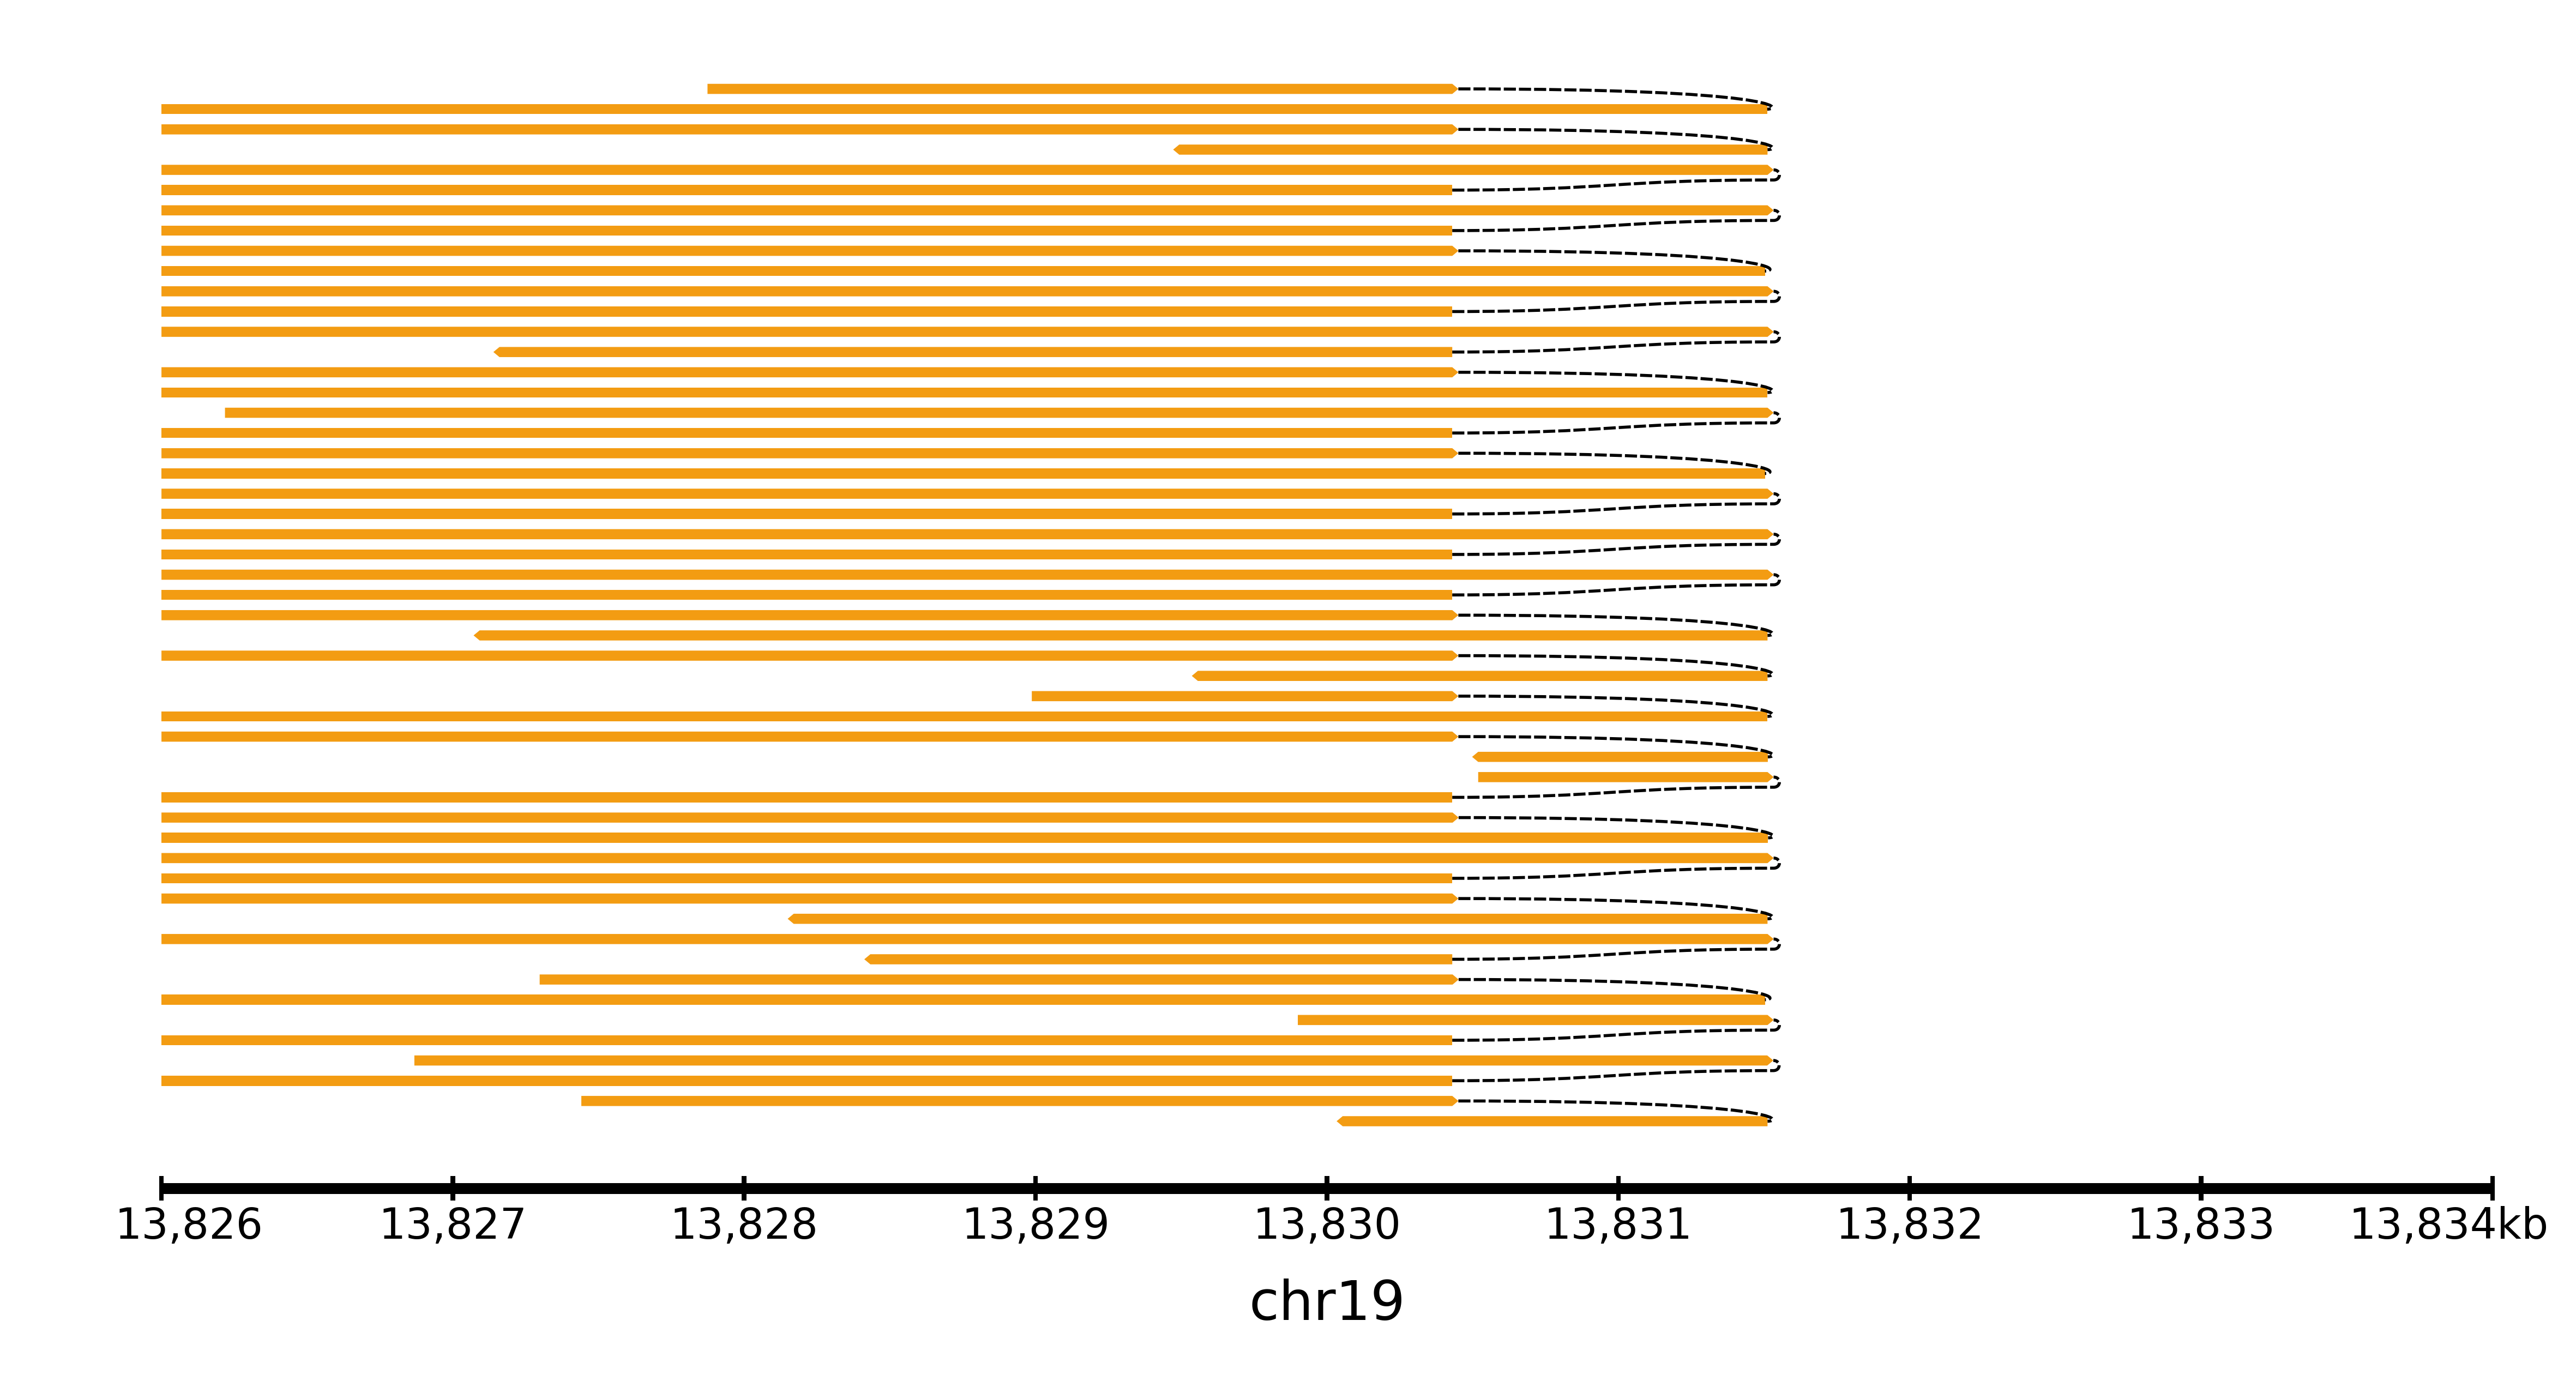
Linking split reads: foldback inversion
Here is an example of nanopore reads spanning a foldback inversion (resulting from a breakage-fusion-bridge cycle, and leading to amplification of a genomic region), where the links between split reads can show this foldback inversion.
{
        "general": {
                "layout": "horizontal",
                "reference": "hg19"
        },
        "output": {
                "file": "figure_foldback.png",
                "dpi": 800,
                "width": 150
        },
        "regions": [
                {
                        "chr": "19",
                        "start": 13826000,
                        "end": 13834000
                }
        ],
        "highlights": [],
        "tracks": [
                {
                        "type": "alignments",
                        "height": 70,
                        "margin_above": 1.5,
                        "bounding_box": false,
                        "fontscale": 1,
                        "file": "/path/to/sample.haplotagged.bam",
                        "label": "",
                        "label_rotate": false,
                        "hgap_bp": "180",
                        "vgap_frac": "0.5",
                        "read_color": "#cccccc",
                        "link_splitreads": true,
                        "splitread_color": "#f39c12",
                        "link_color": "#000000",
                        "link_lw": "0.5",
                        "only_show_splitreads": true,
                        "min_splitreads_breakpoints": 2,
                        "group_by": "none",
                        "color_by": "none"
                },
                {
                        "type": "chr_axis",
                        "height": 10,
                        "margin_above": 1.5,
                        "bounding_box": false,
                        "fontscale": 1,
                        "label": "",
                        "label_rotate": false,
                        "style": "default",
                        "lw_scale": "1.0",
                        "ticklabels_pos": "below",
                        "unit": "kb",
                        "ticks_interval": "auto",
                        "ticks_angle": 0,
                        "chr_prefix": "chr"
                }
        ]
}
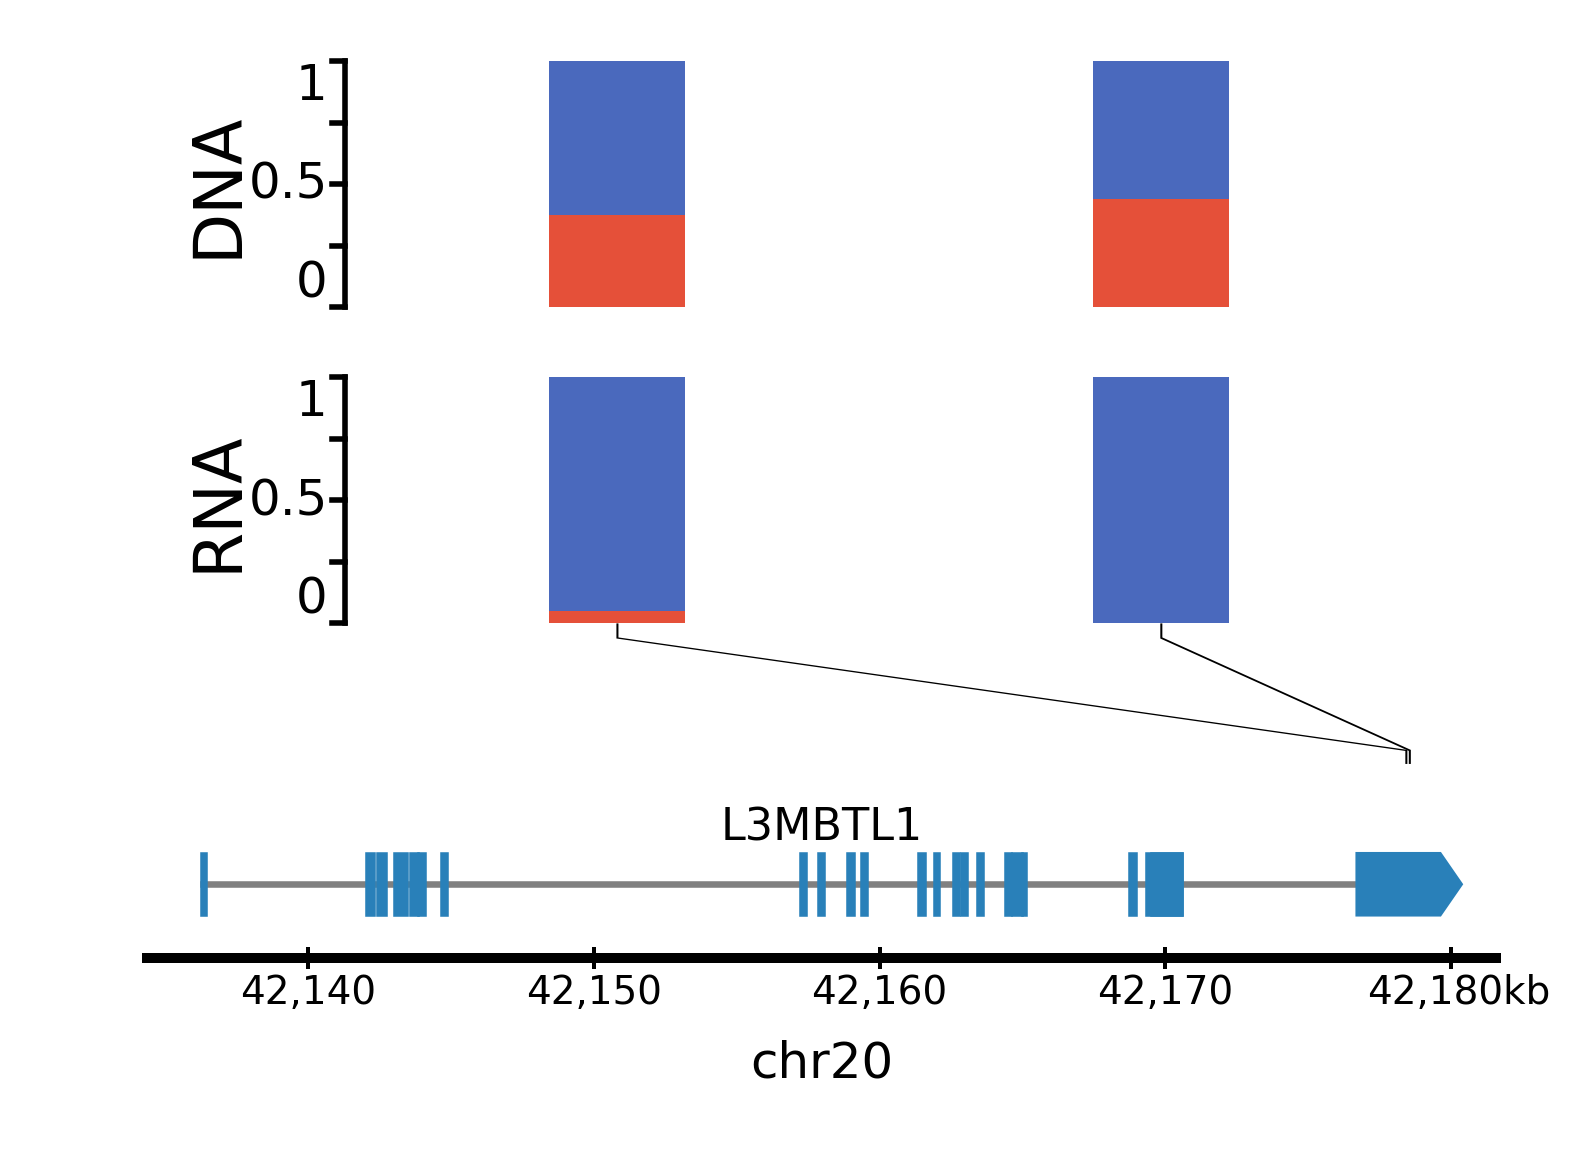
Allele-specific expression
The ase track can be used to visualize allele-specific expression. For each variant, the minor allele frequency in the DNA is shown at the top (showing that the variants are heterozygous), and the minor allele frequency in the RNA-seq data is shown at the bottom. Here, we see that only one allele of L3MBTL1 is expressed, because this gene is imprinted.
{
        "general": {
                "layout": "horizontal",
                "reference": "hg19"
        },
        "output": {
                "file": "/home/e840r/Documents/Scripts/figeno/figeno/gui/figure_ase.png",
                "dpi": 400,
                "width": 100
        },
        "regions": [
                {
                        "chr": "20",
                        "start": 42134174,
                        "end": 42181756
                }
        ],
        "highlights": [],
        "tracks": [
                {
                        "type": "ase",
                        "height": 50,
                        "margin_above": 1.5,
                        "bounding_box": false,
                        "fontscale": 1,
                        "label": "RNA,DNA",
                        "label_rotate": true,
                        "file": "/path/to/sample.tsv",
                        "vcf_DNA": "",
                        "min_depth": "6",
                        "color1": "#e55039",
                        "color2": "#4a69bd",
                        "max_bar_width": "10.0",
                        "lw": "0.1",
                        "only_exonic": false,
                        "grid": false
                },
                {
                        "type": "genes",
                        "height": 10,
                        "margin_above": 1.5,
                        "bounding_box": false,
                        "fontscale": 1,
                        "label": "",
                        "label_rotate": false,
                        "style": "default",
                        "collapsed": true,
                        "only_protein_coding": true,
                        "exon_color": "#2980b9",
                        "genes": "auto",
                        "show_gene_names": true
                },
                {
                        "type": "chr_axis",
                        "height": 10,
                        "margin_above": 1.5,
                        "bounding_box": false,
                        "fontscale": 1,
                        "label": "",
                        "label_rotate": false,
                        "style": "default",
                        "lw_scale": "1.0",
                        "ticklabels_pos": "below",
                        "unit": "kb",
                        "ticks_interval": "auto",
                        "ticks_angle": 0,
                        "chr_prefix": "chr"
                }
        ]
}